Run a One Line report
To run a One Line report, follow the instructions below. If no reports can be run with the selected configuration, the list of reports will be grayed out.
- Open the Result Sets Explorer. Click on "+" next to the Result Set you want to report on, and the list of Runs will be displayed. Double-click on a Run.
- Select the Palantir Reporting option in the Output pane. The Palantir Reporting screen will be opened (for more information, see The Palantir Reporting screen).
- The box on the left will show the hierarchy for the selected Result Set. You can change the way the hierarchy is displayed by selecting an option from the Select Report View list. Projects can be sorted by any property (country, analyst, region, etc.). If you plan to use this function, make sure that all project properties are specified; otherwise, projects will appear under the <None> node. You can manage these views by selecting the <Manage Views> option (see Manage report views).
- Select the Selected consolidation nodes option in the Select Result Type field.
- Select a Calculation Parameters document. This is important when different Calculation Parameters are linked at different levels of the hierarchy.
- Select the nodes you want to include into the report. If you right-click on a node, you will find more selection options in the context menu.
- Select report templates in the Selected Report Templates section. Reports will be generated for all templates listed here.
- In the Selected Reporting Runs section, first choose the reporting mode and then Result Set Runs which should be included in reports. If your templates are made to show values from several Runs side by side, select the Generate sensitivity run report option and assign reporting Runs to actual Runs in the selected Result Set. If each template shows values for one Run only, select Generate reports for multiple runs and the same report will be generated for each Run you select.
- As you select nodes and choose reporting options, new items will appear on the List of reports being generated. If a report can be run, its status will be set to Valid. If reports have the same name, they will be renamed by adding a sequential number at the end of the name. Report naming conventions are set on the Path Settings tab (see The Path Settings tab).
- Switch to the Report Options tab to select additional options such as currency or periodicity (see The Report Options tab).
- Switch to the Path Settings tab to specify where reports will be stored and how they will be named (see The Path Settings tab).
- Click on the Run button to run the reports. As reporting progresses, the status of reports will be changed to Completed.
- To open a completed report, click on its name on the list or use the Open Reports and Close Reports buttons to open and close all reports simultaneously. The Goto Files option allows you to navigate to the saved reports' location in Windows Explorer and open them as ordinary Excel files.
Rank and Cut
The Rank and Cut tool allows you to sort and select projects on the basis of several criteria at once. To launch it, click on 

Note: The list of variables used by the tool is the same as the list of variables linked to the report.
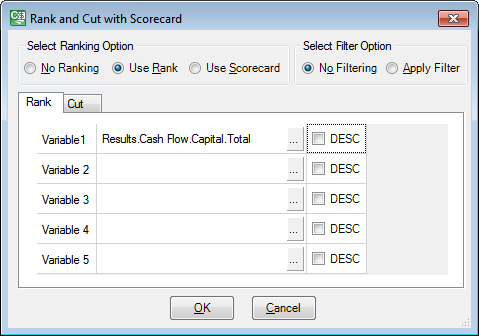
To rank projects, switch to the Rank tab and select the Use Rank option at the top of the window. Select the variables, on which the ranking will be based, by clicking on 
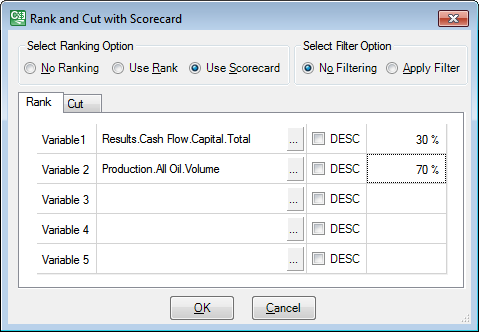
The Use Scorecard option allows you to perform weighted ranking based on up to five variables at once. When you select it, one more column in the table will become active; use it to enter weightings as shown below. The sum of weightings should be equal to 100%; if it is not, the system calculates the last variable's weighting and balances it to bring the total to 100%.

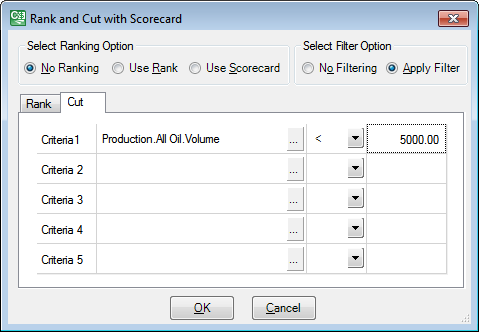
The Cut tab allows you to automatically exclude projects, which do not satisfy certain conditions, from your report. Select the Apply Filter option at the top of the window. Select the variables, on which the selection will be based, by clicking on 
